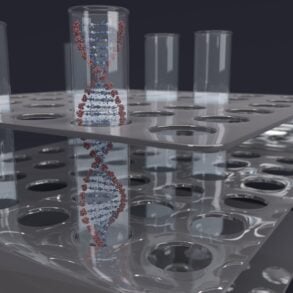


A small tube of blood holds a crowd of different cell types. For many medical questions, what matters is how many of each kind are present, and a flow cytometer answers that by examining the cells one at a time. Writing in Nature Reviews Immunology in 2012, Maecker, McCoy and Nussenblatt describe newer instruments that measure eight or more features of each cell at thousands of cells per second. When a drug trial runs in many countries, the harder problem is getting every lab to read those cells the same way.
Single file through a beam of light
Inside the machine, cells travel in liquid. According to Katherine McKinnon of the National Cancer Institute’s Vaccine Branch, writing in Current Protocols in Immunology in 2018, flow cytometry rapidly analyzes single cells as they flow past one or more lasers while suspended in a buffered salt solution. A sheath fluid, usually buffered saline, is pressurized to carry the sample and focus it to the point where the laser beam crosses. The cells arrive in single file, like travelers passing a checkpoint one by one.
Each cell that crosses the beam scatters light. Light scattered in the forward direction indicates the relative size of the cell. Light scattered at 90 degrees, the side scatter signal, indicates the cell’s internal complexity or granularity, meaning how much internal structure, such as granules, the cell carries. Those two signals give a rough first sort before any dye comes into play.
Glowing labels and what the colors mean
To pick out specific cell types, the machine needs labels. The most used application, according to McKinnon’s overview, is immunophenotyping: cells are stained with antibodies carrying fluorescent dyes, aimed at proteins called antigens on the cell surface. An antibody is a protein that sticks to one specific target, much as a key fits one lock.
A dye hit by the laser gives off light in its own color, marking the cell as one that carries that protein. Filters steer the fluorescent light to specific detectors and select the wavelengths each detector reads, so every dye is measured separately. Each dye color becomes its own measurement, called a channel or parameter.
McKinnon writes that instruments often have 20 parameters: the two scatter signals plus 18 fluorescence detectors. Current instruments and reagents can run 28 color experiments, though 12 to 15 colors is more common. Dye colors overlap, each spilling a little light into its neighbors’ detectors, and compensation is the correction that removes that overlap.
Gating: drawing lines around the cells that matter
The raw data are a list of events, one per cell, each carrying every measurement. An analyst reads them as dot plots, two measurements at a time, with each cell shown as a dot. Gating means drawing a boundary around a cluster of dots to select a population, then looking only at those cells on the next pair of measurements.
McKinnon notes that this kind of two parameter dot plot gating is still frequently used. In a typical sequence, the first plot shows side scatter against forward scatter, and a gate goes around the white blood cells. The next plot shows only those cells, now sorted by their labels, and a second gate picks out one kind of immune cell.
From hospital labs to drug trials
McKinnon’s overview notes that flow cytometry can characterize mixed cell populations from blood, from bone marrow, and from solid tissues such as lymph nodes and tumors once they are broken apart into single cells. The National Cancer Institute’s clinical flow cytometry unit evaluates blood, bone marrow, biopsies and body fluids for blood cancers such as leukemia and lymphoma.
Most of that unit’s testing is detection of minimal residual disease, the small numbers of cancer cells that can remain after treatment. In a 2010 paper in Nature Immunology, Maecker and McCoy describe flow cytometry being used to monitor immune measurements in clinical trials. They also point to growing interest in collecting more of this information in early trials, to better predict how candidate drugs will perform.
Why two labs can read the same blood differently
Send one blood sample to two labs and the numbers may not match. Maecker and McCoy name sample handling, instrument setup and data analysis as the main barriers. Whether whole blood is stained before or after red blood cells are removed, the time and temperature of staining, and even the batch of staining reagent can all change the result.
The machines differ too. Maecker, McCoy and Nussenblatt wrote in 2012 that instruments of different configurations or from different makers show marked performance differences, which makes standardization between sites, or even between two instruments at one site, difficult. Yet according to a 2010 analysis in Nature Immunology, differences in gating are perhaps the largest single contributor to variability. In one multisite study, identical prestained, freeze dried cells went to 15 experienced laboratories. When each lab gated its own data, the mean coefficient of variation was 20.5 percent. When the same files were analyzed centrally, it fell to 4 percent.
What harmonization looks like in a multicountry trial
Harmonization means getting every lab and instrument in a study to produce comparable numbers. The 2012 review describes standard antibody panels and freeze dried reagent plates, which decrease staining variability compared with individual liquid reagents. Le Lann and colleagues, reporting in Scientific Reports in 2020, first aligned eleven instruments to one reference with calibration beads, tiny particles of fixed brightness, then analyzed blood from 2,559 people over four years.
For gating differences that remain, Maecker and McCoy point to a shared gating template or central analysis by a single operator. CLSI H62, a guideline published by the Clinical and Laboratory Standards Institute in October 2021, sets out procedures for instrument qualification, standardization and assay optimization. One trial lab, MLM Medical Labs, says its harmonized flow cytometry services rely on assays validated and harmonized under CLSI H62 across its labs in the United States and Europe, with daily instrument calibration and global gating strategies.
Shipping every sample to one central laboratory makes standardization easier, Maecker and McCoy note, but adds the uncertainties of transport. In the mixed model they describe, local sites process samples under strict procedures, a central lab confirms those procedures and trains staff, and each site’s instruments must be standardized to detect the expected staining in the same way.